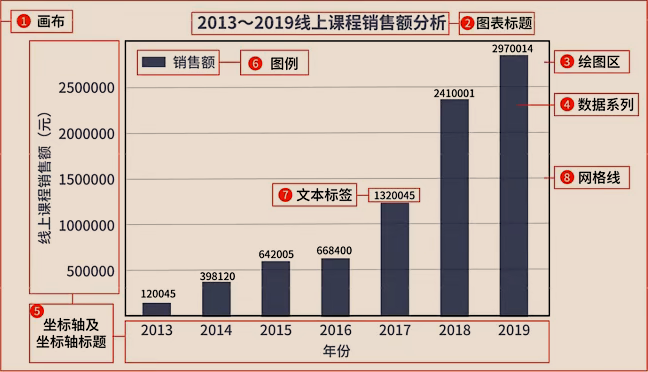
画布、图表标题、绘图区、数据系列、坐标轴、坐标轴标题、图例、文本标签、网格线等
matplotlib
用于数据可视化、绘制各种图表
- 引入
matplotlib模块
- 使用其提供的
plot等方法绘制图表
- 运行程序
图表常用设置
1
| matplotlib.pyplot.plot(x,y,format_string,**kwargs)
|
- x/y:x/y轴数据
- format_string:控制曲线格式的字符串,包括颜色、线条样式和标记样式
- kwargs:键值参数,相当于一个字典
color参数设置线条颜色
| 设置值 |
说明 |
设置值 |
说明 |
| b |
蓝色 |
y |
黄色 |
| g |
绿色 |
k |
黑色 |
| r |
红色 |
w |
白色 |
| c |
蓝绿色 |
#FF00FF |
紫色 |
| m |
洋红色 |
0.5 |
灰度值字符串 |
linestyle参数设置线条样式
- 线条样式
- 实线:’-‘
- 双划线:’–’
- 点划线:’-.’
- 虚线:’:’
- 标记样式
marker参数设置markerfacecolor可以修改标记的颜色,简写为mfc
| 设置值 |
说明 |
设置值 |
说明 |
| . |
点标记 |
1 |
下花三角标记 |
| , |
像素标记 |
2 |
上花三角标记 |
| o |
实心圆标记 |
3 |
左花三角标记 |
| v |
倒三角标记 |
4 |
右花三角标记 |
| ^ |
上三角标记 |
s |
实心正方形标记 |
| > |
右三角标记 |
p |
实心五角形标记 |
| < |
左三角标记 |
* |
星形标记 |
1
| matplotlib.pyplot.figure(num=None,figure=None,dpi=None,facecolor=None,edgecolor=None,frameon=True)
|
- num:图像编号或名称,数字为编号,字符串为名称,可以通过该参数激活不同的画布
- figsize:指定画布的宽和高,单位为英寸
- dpi:指定绘图对象的分辩率,即每英寸包含多少个像素,默认值为80。像素越大,画布越
大
- facecolor:背景颜色
- edgecolor:边框颜色
- frameon:是否显示边框,默认值为True,绘制边框,如果为False,则不绘制边框
- 设置坐标轴标题:xlabel/ylabel函数
- 设置坐标轴刻度:xticks/yticks函数
- 设置坐标轴范围:xlim/ylim函数
- 设置网格线:grid()函数 参数与plot函数相差不大
处理中文显示:matplotlib.pyplot.rcParams[‘font.sans-serif’]=[‘SimHei’]
1
| matplotlib.pyplot.text(x,y,s,**kwargs)
|
| 通用绘图参数 |
说明 |
| fontsize |
字体大小 |
| ha |
水平对齐方式 |
| va |
垂直对齐方式 |
1
2
| matplotlib.pyplot.title()
matplotlib.pyplot.legend(loc='best')
|
| 位置 |
描述 |
位置 |
描述 |
位置 |
描述 |
| best |
自适应 |
upper right |
右上方 |
upper left |
左上方 |
| lower right |
右下方 |
lower left |
左下方 |
right |
右侧 |
| center left |
左中间 |
center right |
右中间 |
upper center |
上中间 |
| center |
正中央 |
lower center |
下中间 |
|
|
直接使用plt.legend(‘图例示例’)会显示不全,这时需修改为plt.legend((‘图例示例’,))
1
| matplotlib.pyplot.annotate(s,xy,xytext,xycoords,arrowprops)
|
1
| matplotli b.pyplot.subplots_adjust(left,right,top,bottom)
|
1
2
3
| matplotlib.pyplot.tick_params(bottom,left,right,top)
matplotlib.pyplot.rcParams['xtick.direction']='in'
matplotlib.pyplot.rcParams['ytick.direction']='out'
|
常用图表绘制
1
| matplotlib.pyplot.bar(x,height,width,*,align='center',**kwargs)
|
- x:x轴数据
- height/width:高度/宽度
- align:对齐方式
- kwargs:关键字参数
1
| matplotlib.pyplot.hist(x,bins)
|
- x:数据集,最终直方图将对数据集进行统计
- bins:统计数据的区间分布
1
| matplotlib.pyplot.pie(x,labels,colors,labeldistance,autopct,startangle,radius,center,textprops)
|
- x:每一块饼形图的比例
- labels:每一块饼形图外侧显示的说明文字
- colors:
- labeldistance:标记的绘制位置,相对于半径的比例,默认值为1.1
- autopct:设置饼图百分比,可以使用格式化字符串或format函数
- startangle:起始绘制角度,默认是x轴正方向逆时针
- radius:饼图半径,默认值为1
- center:浮点类型的列表,可选参数,默认值为(0,0)表示图表中心位置
- textprops:设置标签和比例文字的格式,字典类型